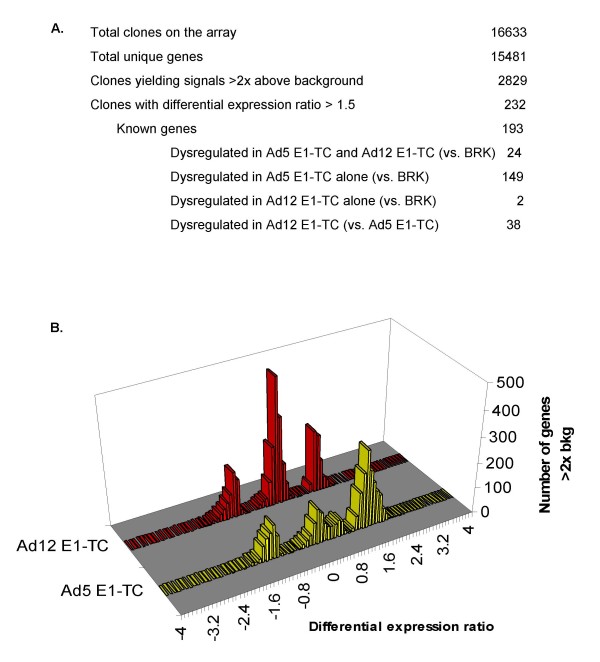
Figure 1.
cDNA microarray analysis of differential gene expression between non-tumorigenic Ad5 E1-TC, tumorigenic Ad12 E1-TC and untransformed BRK cells. A. Summary of the rat GeneFilters microarray analysis. B. Distribution of differential gene expression after normalisation for all data points in Ad E1-TC relative to untransformed BRK cells. Number of genes represents those that were above twice that of the array background in at least one set of duplicate cell types.

