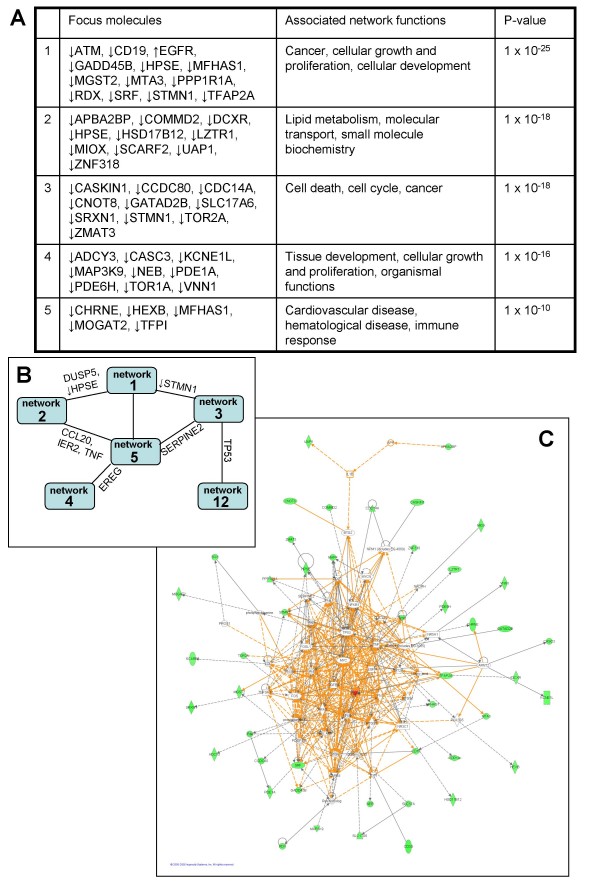
Figure 10.
Ingenuity network analysis of the dysregulation in Ad12 E1-TC compared to Ad5 E1-TC. The top five highest scoring networks are summarised (a) with the most significant associated network functions and focus molecules, and (b) there was considerable overlap between networks (shared molecules are indicated). The simplified merged network (c) gives an idea of the complicated cross-talk between networks 1, 2, 3, 4, 5 and 12, with molecules identified as down-regulated or up-regulated by the microarray study depicted in green or red, respectively.

