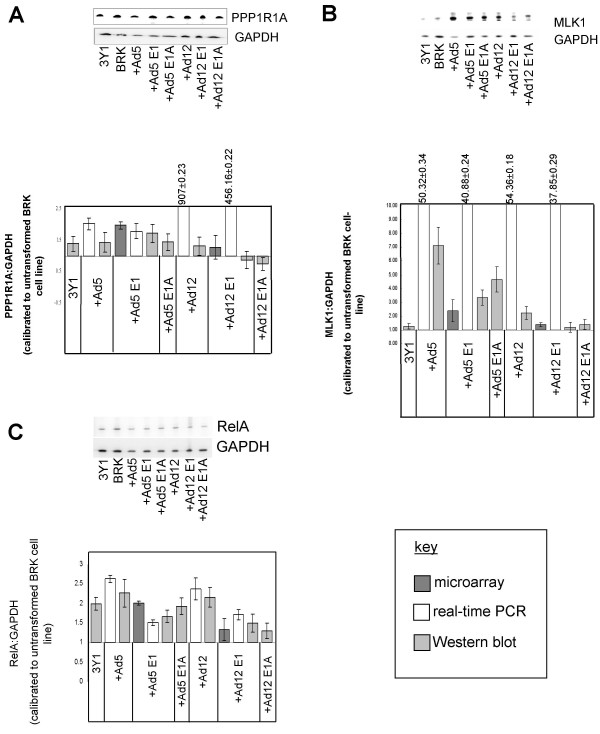
Figure 8.
Biological validation of microarray results by real-time PCR and Western Blotting. Expression levels of (a) protein phosphatase 1, regulatory (inhibitor) subunit 1A (PPP1R1A), (b) mixed lineage kinase 1 (MLK1, synonym MAP3K9) and (c) RelA were investigated at the RNA level by microarray analysis (dark grey bars) and real-time PCR (white bars) and at the protein level by Western Blotting (light grey bars). Examples of membranes stained for the target protein of interest then subsequently GAPDH are given. The average intensity ratio of target protein of interest to GAPDH (calibrated to that in untransformed BRK cells) was calculated using density of band signals. The microarray results were obtained from two copies of each membrane screened in duplicate. The real-time PCR results represent three RNA samples per cell-line run in triplicate.

