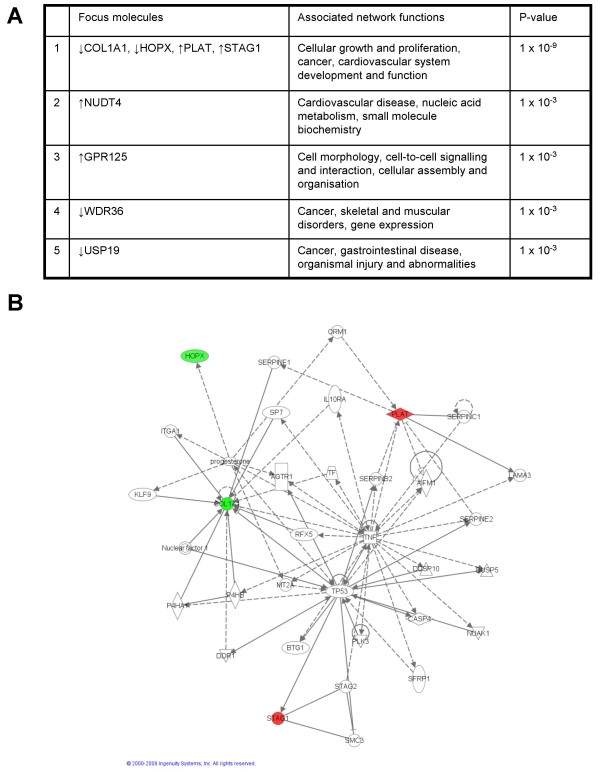
Figure 9.
Ingenuity network analysis of the dysregulation in Ad12 E1-TC compared to untransformed BRK cells. Overall, less dysregulation of transcripts in Ad12 E1-TC compared to untransformed BRK cells was found by the microarray study so not many focus molecules were returned by IPA (a). The top scoring network (b) contains two molecules associated with cancer; HOPX and PLAT.

