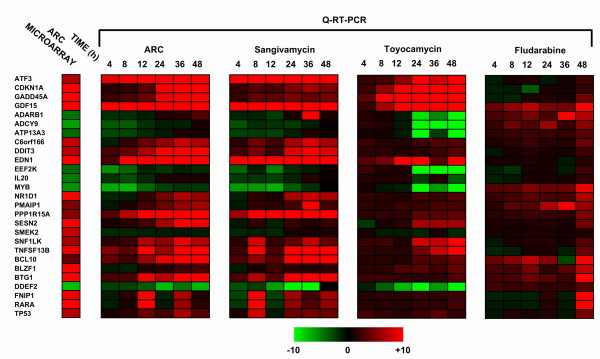
Figure 5.
Cells treated with ARC or sangivamycin demonstrate almost identical changes in gene expression as determined by Q-RT-PCR. MCF7 cells were treated with the same dose (2 μM) of ARC, sangivamycin, toyocamycin or fludarabine over a time course (4, 8, 12, 24, 36 or 48 h). Total RNA was then prepared from each sample and reverse transcribed to cDNA. Each cDNA sample was then analyzed by Q-RT-PCR to determine changes in mRNA expression for 27 genes involved in processes such as the response to cellular stress, DNA damage/repair and apoptosis, that had previously been identified as modulated in microaray analysis of ARC treated MCF7 cells. Data is represented in the form of a heat map with limits of expression set at +10 fold (red) and -10 fold (green) and the primary results from microarray analysis for the same gene subset of MCF7 cells treated with ARC for 24 h shown (column, left).

