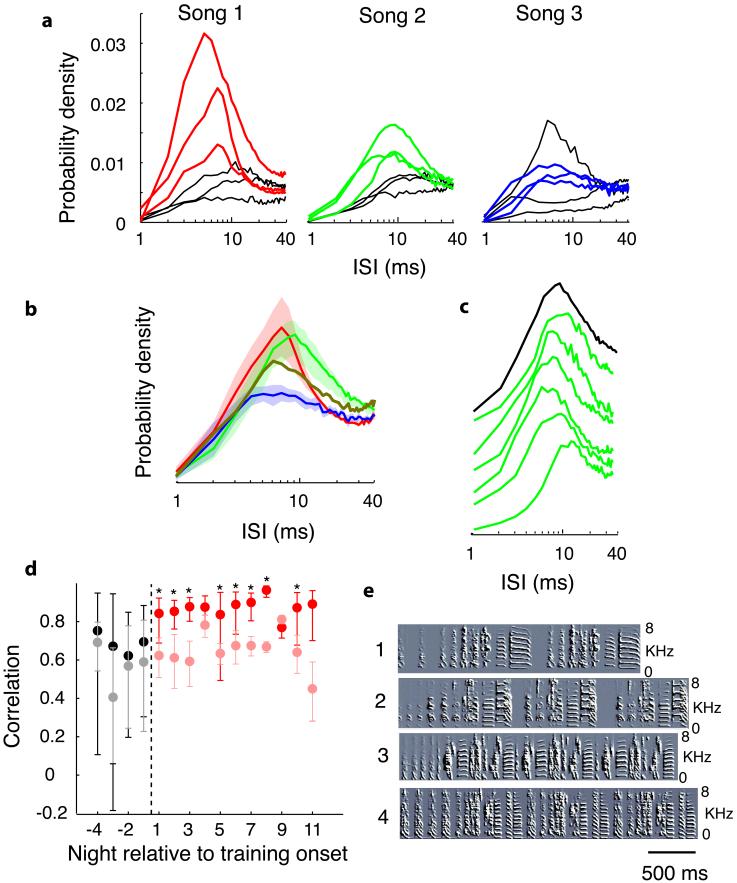
Figure 2.
Tutor songs shape RA bursting. a, ISI distributions averaged across all post-exposure nights, one per bird, by tutor song. Black lines are pre-exposure, coloured lines post exposure. Song 1, n=3 birds, 59 cells (only a representative 3 of 7 birds are shown to reduce clutter, see Supplementary Fig. 4 for all birds); Song 2, n=3 birds, 85 cells; Song 3, n=3 birds, 38 cells. b, Global mean (±SEM) ISI distributions following tutor song exposure, one curve for each tutor song group. For Song 1, two birds with the largest high frequency peaks were removed from the average so that curves have comparable peak heights for comparison. Brown line is the single Song 4 bird. c, Green lines are averages for each of the six post-exposure nights in one bird; black line is Song 2 global mean (from Fig. 2b). d, ISI distributions change upon tutor song exposure. Pearson correlation coefficients comparing nightly curves for given bird with global post-exposure means (see text). Nightly means (±SD) comparing birds hearing the same (pre- and post-exposure, black and red dots, respectively) or different (grey and pink dots, respectively) tutor songs. e, Tutor song spectrographs.

