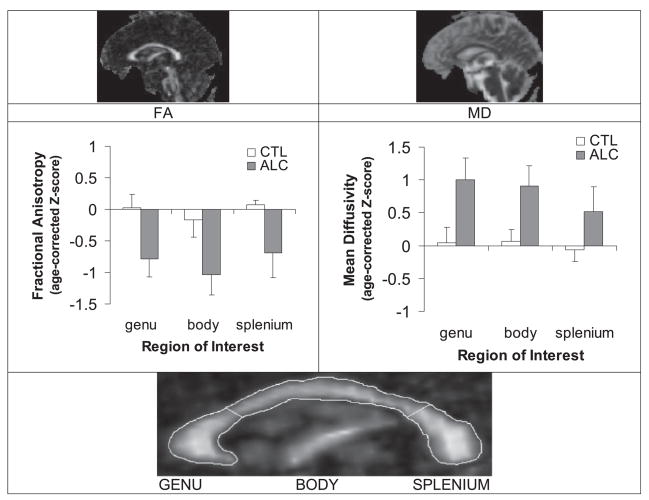
Fig. 3.
Midsagittal fractional anisotropy (FA) image (left), where white matter is the brightest and mean diffusivity (MD) image (right), where CSF is the brightest, of a 61-year-old healthy man. Mean ± SE of the regional FA (left) and MD (right), expressed as age-corrected Z-scores, for controls (CTL) and alcoholics (ALC). ALC showed callosal microstructure deficits evidenced in lower FA and higher MD than CTL. Bottom: Expanded midsagittal view of the FA image of the corpus callosum (CC). The CC (outlined) was identified with a semiautomated procedure. The genu and splenium were determined geometrically and defined the borders of the body.

