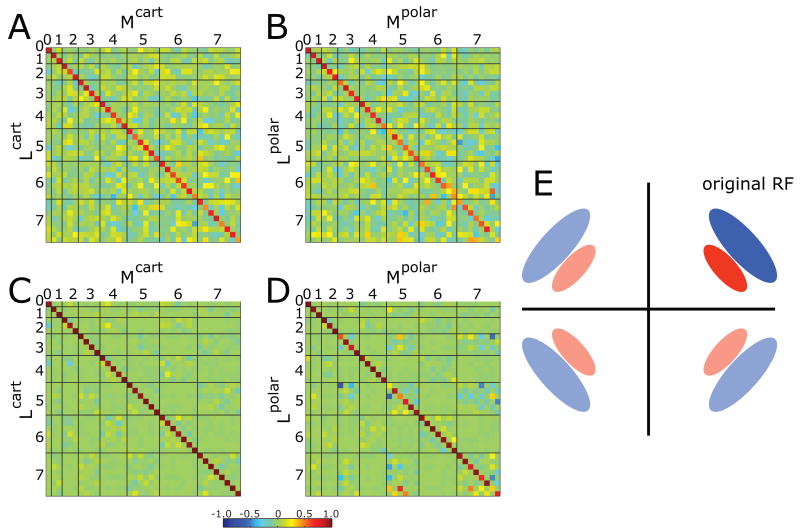
Figure 4. Comparison of receptive fields computed by the two models.
Panels A- B: Pseudocolor display of the rotation matrix that is the optimal transformation between receptive fields estimated by two methods (reverse correlation (L-filters) and MID (M-filters)) from one set of stimuli. A: Cartesian stimuli. B: polar stimuli. Panels C and D: The same calculations, augmented by adding receptive fields reflected around horizontal and vertical axes (panel E). The heavy lines in panels A-D separate the ranks, shown increasing from 0 to 7. Within each rank, basis elements are ordered from most centrally-weighted (middle of pyramid of Figure 1 right) to most peripherally-weighted (edges of pyramid of Figure 1 right). Color scale covers the interval [-1 1], with green indicating 0, red-brown indicating 1, and blue indicating -1. The matrices are all similar to the identity matrix, indicating close correspondence between receptive fields derived by the two methods.

