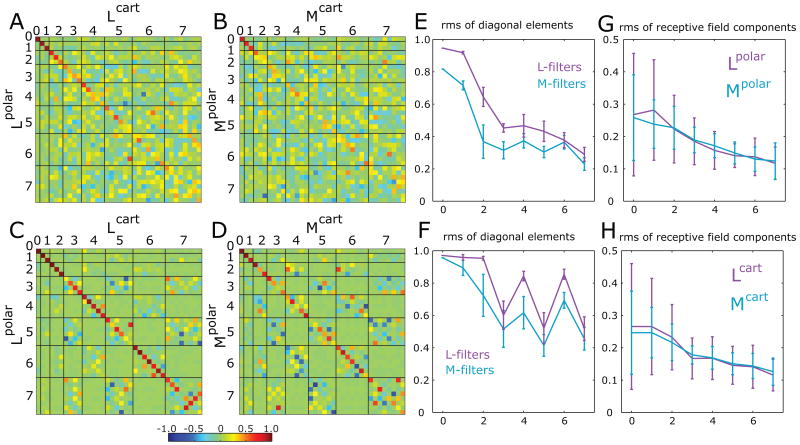
Figure 5. Comparison of receptive fields derived from Cartesian and polar stimuli.
Panels A-B: Pseudocolor display of the rotation matrix that is the optimal transformation between a set of receptive fields determined from responses to the two contexts (Cartesian vs. polar) with either modeling method: L-filters (panel A) or M-filters (panel B). Panels C and D: The same calculations, augmented by adding receptive fields reflected around the vertical and horizontal axes. For both models, rotation matrices show that odd-ranked coefficients change more between Cartesian and polar stimuli than the even-ranked coefficients. Display details as in Figure 4. E: root-mean-square (rms) of rotation matrix diagonal elements at each rank, derived from L-filters (magenta, based on panel A) and M-filters (blue, based on panel B). Panel F shows the analogous rms values computed using the symmetry-augmented datasets, taken from panels C and D. Error bars in panels E and F show standard errors of the mean within each rank. The decrease in the amplitude of diagonal values is strongly non-monotonic: odd ranks are further from the identity than even ranks, showing that odd ranks have a greater systematic context-dependence than even ranks. Panels G and H show the overall magnitude of the receptive field components derived from responses to Cartesian and polar stimuli. Error bars in panels G and H show standard deviations across different cells and components within a given rank. The difference between even and odd rank receptive field components in E and F is not explained by the difference in their magnitude or estimation error, which changes monotonically.

