
Figure 3.
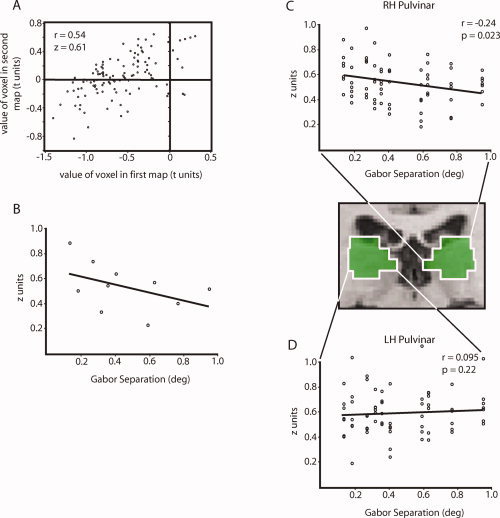
Computation of position discrimination slopes. (A) A sample correlation between two volumetric activity maps, performed on voxels within a 5 mm3 ROI in the right pulvinar. Each voxel's value in the second map was plotted against its value in the first map, and a Pearson r was computed on this plot to provide a measure of the similarity of the two maps. The resulting r value from this correlation was converted to a Fisher z score by
 . Note that many voxels have negative values in one or both activity maps. Although activity within these voxels is downwardly modulated by the stimuli, this activity still has the potential to carry precise information about the positions of the stimuli [Bressler et al., 2007]. (B) Each z score computed as in (A) was plotted with nine other z scores computed in the same way, representing all possible pairs taken from the five volumetric activity maps associated with each subject. Each z score was plotted against the corresponding increment in Gabor position. The slope of a regression line fit to this plot provides an index of stimulus discrimination within the given ROI. This plot shows the z scores for the right hemisphere pulvinar ROI in a representative subject. (C) Fisher z scores from the right pulvinar ROI in all seven subjects; z scores for each subject were normalized to that subject's mean z score. A linear regression fit to this plot revealed a significant correlation (r = 0.24, P = 0.023, slope = 0.155), indicating significant position discrimination in the right hemisphere pulvinar. (D) Fisher z scores from the left pulvinar ROI in all seven subjects, normalized as in the previous plot. A linear regression fit to this plot was not significant (r = 0.073, P = 0.27, slope = 0.049). The regression coefficients for the left and right pulvinar plots were also significantly different from each other (Z = 1.84, P = 0.033).