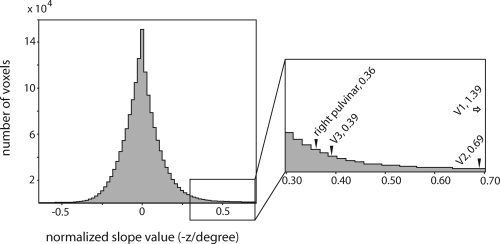
Figure 6.

Distribution of slope values for all voxels in the brain. Position discrimination maps were averaged across the seven subjects as in Figure 5, and the 1,762,396 voxels in the resulting position discrimination map that fell inside the brain were plotted in a histogram with bin size 0.02. Right hemisphere pulvinar, along with the early visual cortical areas, falls in the extreme right tail of this histogram. The voxels in the right pulvinar showing the strongest position discrimination had slope values of 0.36, placing them among the top 1.43% of voxels in the brain. Peak slope values for V1, V2, and V3 are shown for comparison.
