
Figure 1.
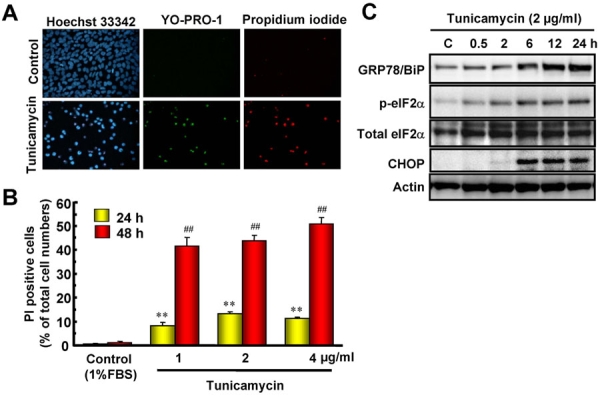
Retinal cell death and time-course of changes in endoplasmic reticulum (ER)-stress related proteins induced by tunicamycin. A: Representative fluorescence microscopy showing nuclear stainings for Hoechst 33342 (blue), YO-PRO-1 (green), and propidium iodide (PI, red) at 48 h after addition of tunicamycin at 1 μg/ml. B: The number of cells displaying PI fluorescence was counted at two time-points, and positive cells were expressed as the percentage of PI to Hoechst 33342. Each column represents the mean±SEM (n=6). Double asterisks and double hash marks; p<0.01 versus corresponding control group (Dunnett's test). C: Representative immunoblots showing the time-course of changes in protein levels (GRP78/BiP, phosphorylated-eIF2α, total eIF2α, and CHOP) after tunicamycin treatment at 2 μg/ml.