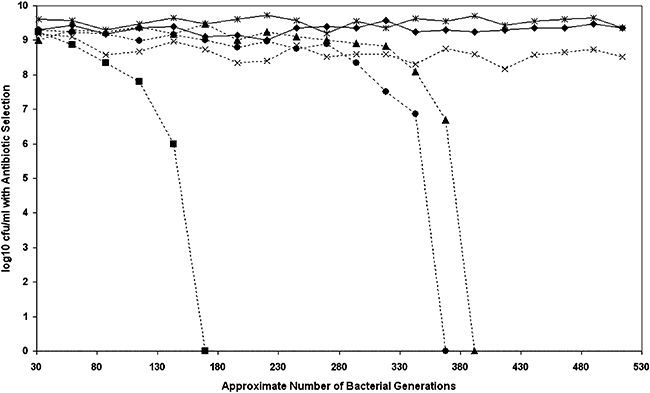
Fig. 3.

Measuring the stability of pBSSB2. Graph demonstrating the stability of pBSSB2 compared with a number of other plasmids. The approximate number of bacterial generations calculated from the initial inoculum at each subculture is represented on the x-axis. The log10 of the average cfu ml−1 at stationary phase for the various experimental strains calculated by serial dilution is represented on the y-axis. The cfu ml−1 was calculated by growth when diluted strains were incubated on LB media supplemented with the appropriate antibiotic. The cfu ml−1 was also calculated on none selective media to ensure normal culture conditions. Strains and plasmids compared; Solid line with diamond, E. coli pBSSB2 (kanamycin); Solid line with star, S. Typhi pBSSB2 (kanamycin); Broken line with cross, E. coli RSF1010 (streptomycin); Broken line with triangle, E. coli pFOS1. (chloramphenicol); Broken line with circle, E. coli pBR322 (ampcillin); Broken line with square, E. coli pUC18 (ampcillin).
