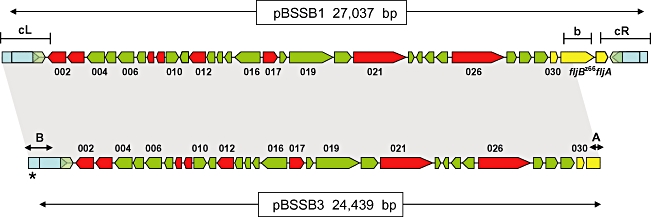
Fig. 5.

Gene map alignment of pBSSB1 and pBSSB3. The map of pBSSB1(upper) is manipulated from Baker et al. (2007) and depicts the 33 open reading frames encoded on the element. Predicted coding sequences with no similarities to other coding sequences in database searches are coloured green, while those with predicted functions are coloured red. Previously sequenced genes including fljBz66 and fljAz66 are coloured yellow and the tir are labelled blue. The targeted locations for primers used in Fig. 4B are demonstrated by; b, fljBz66 and the left and right tir, cL and cR respectively. The shaded region between pBSSB1 and pBSSB3 demonstrates identical sequence. The palindromic terminus sequence (as shown in Fig. 7) are labelled A and B. The asterisk distinguishes the location of the addition 120 bp at the left terminus.
