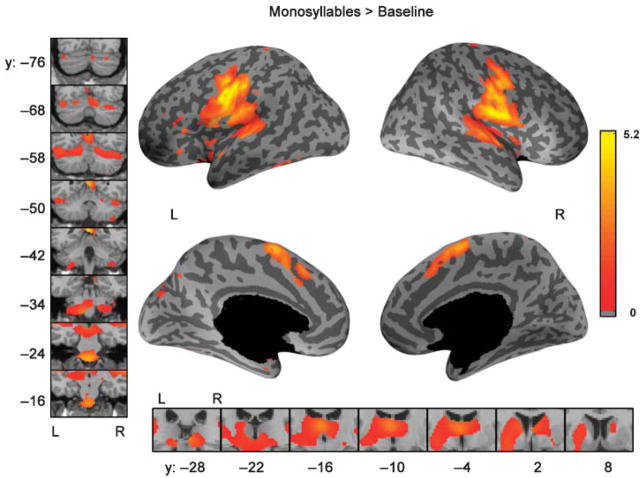
Figure 3.
Comparison of speaking a single monosyllable to the baseline visual condition, standard SPM results. Color indicates the effect size (% signal change of the global mean) from the mixed effects analysis using the SPM toolbox corrected for multiple comparisons using an FDR of 0.05. On the inflated cortical surfaces, the dark gray corresponds to sulci and the light gray corresponds to gyri, while black represents non-cortical regions. The left panel shows coronal slices covering the extent of activation in the cerebellum while the bottom panel shows coronal slices covering the extent of activation in the basal ganglia and thalamus. Y-values refer to planes in MNI-space. The color scale is common to all renderings.

