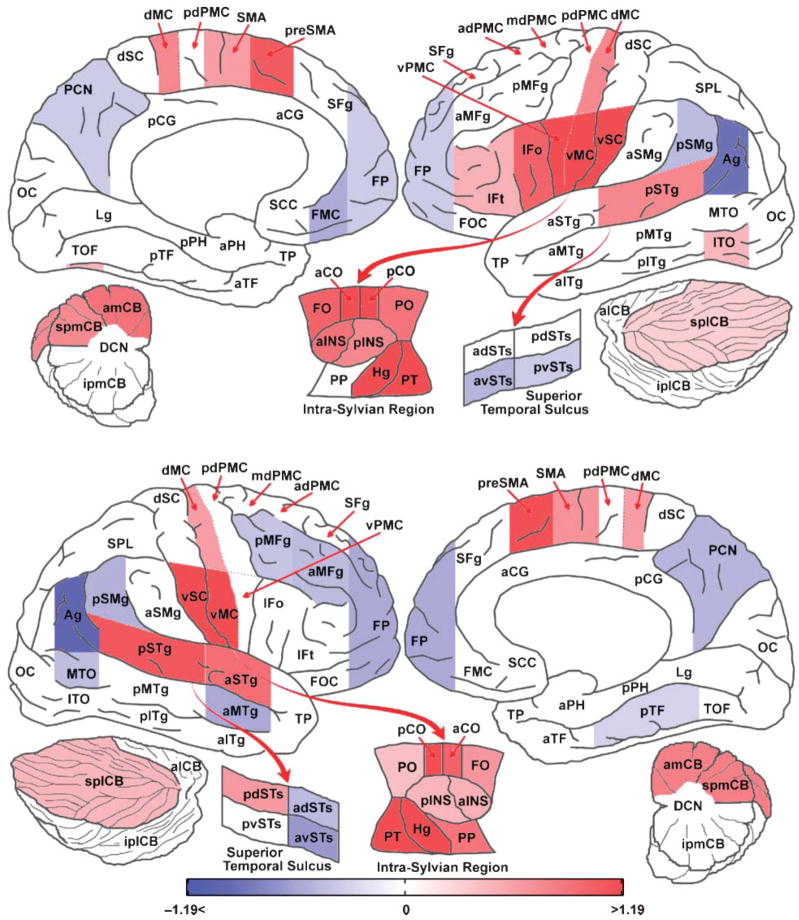
Figure 4.
Comparison of speaking a single monosyllable to the baseline visual condition, ROI analysis. Color indicates the effect size (% signal change of the global mean) from the mixed effects ROI analysis corrected for multiple comparisons using an FDR of 0.05. Areas in red are significantly more active in the monosyllable condition and those in blue are more active in the baseline visual condition. See the caption accompanying Table 4 for a description of the ROI abbreviations.

