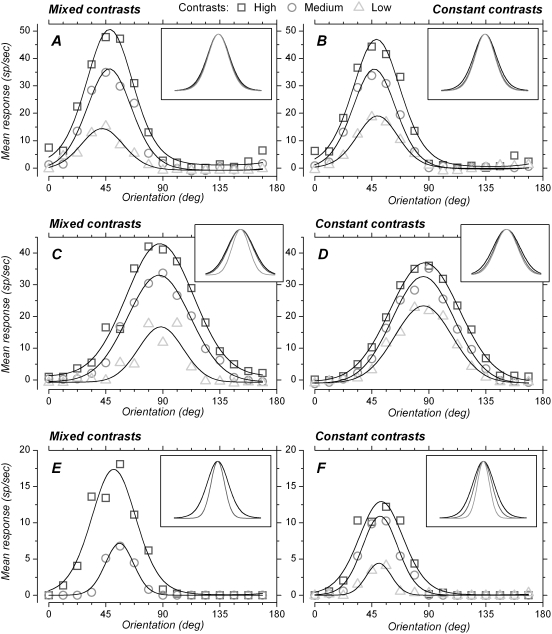
Figure 3. Orientation tuning with different contrasts in mixed and constant contrast blocks, additional examples.
Symbols represent the mean firing rate for each orientation and contrast, and the lines correspond to the von Mises (A, B, E, F) or Gauss (C, D) equations fitted to the orientation-response data. Inset shows fitted lines normalized to the same preferred orientation and to the same height, to facilitate comparison of tuning widths. A. For this cell, contrast, in the mixed contrasts condition, had little effect on orientation tuning width, although response amplitude depended strongly on contrast. Contrasts were 11.3, 16 and 22.6%. HWHH were 20.1, 21.1 and 21.9 deg for low, medium and high contrasts, respectively. B. For the same cell, orientation tuning width was also little affected by contrast in the constant contrast blocks. HWHH were 19.3, 20.2 and 22.4 deg for low, medium and high contrasts, respectively. C. This cell showed, in the mixed contrasts condition, reduced tuning width with low contrast stimuli compared to high or medium contrast stimuli. Contrasts were 22.6, 32 and 64%. HWHH were 20.7, 29.2 and 31.2 deg for low, medium and high contrasts, respectively. D. After matched adaptation (constant contrast), the range of HWHH appears to be less wide. HWHH were 26.7, 28.7 and 32.1 deg for low, medium and high contrasts, respectively. E. No significant response was obtained in this cell with low contrast stimuli (35%) in the mixed contrasts block. The tuning curve obtained with high contrast (90%) was broader (HWHH: 20.9 deg) than the tuning curve obtained with medium contrast (50%, HWHH: 13.2 deg). F. Despite adaptation to matched contrasts, the same cell shows differences in HWHH between low (11.6 deg), medium (16.6 deg) and high (20.85 deg) contrasts.

