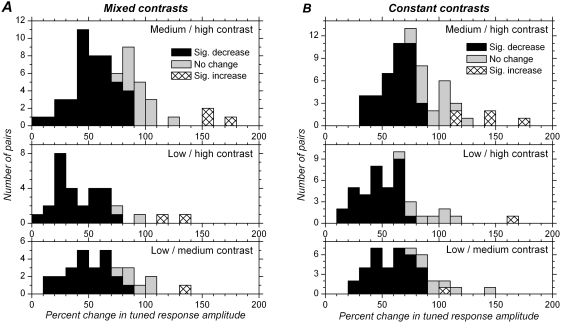
Figure 4. Distribution of changes in tuned response amplitude with different contrasts.
A. Mixed contrasts. B. Constant contrasts. Tuned response amplitude for medium contrast is expressed as a percentage of the tuned response amplitude at high contrast in the upper histograms. Tuned response amplitude for low contrast is expressed as a percentage of the tuned response amplitude at high contrast in the middle histograms, and as a percentage of the tuned response amplitude at medium contrast in the lower histograms. 100% on x-axis corresponds to no change in response amplitude. Relative to 100%, all distributions are shifted to the left, indicating decreased response strength with decreased contrast in nearly all cases. Black bars correspond to significant decreases, and hatched bars to significant increases in response amplitude, tested at the single cell level (p<0.05, t test). In the vast majority of cells, the response amplitude was significantly lower when contrast was decreased.

