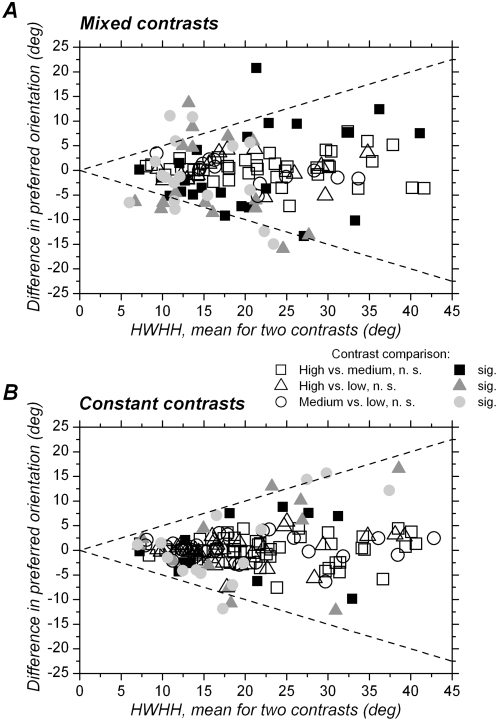
Figure 7. Changes in preferred orientation vs. half-width at half-height of tuning curves.
A. Mixed contrasts. B. Constant contrasts. The x-axis corresponds to the mean of the two HWHHs obtained with the two contrasts that are compared. The y-axis represents the difference in preferred orientation observed with the same contrasts. Squares: high compared to medium contrast. Triangles: high compared to low contrast. Circles: Medium compared to low contrast. Cells for which preferred orientation changed significantly (p<0.05, t test) are represented by filled symbols (“sig”) and cells for which preferred orientation did not change significantly by open symbols (“n. s.”). The diagonals represent the relation y = ±0.5x. Data points between the diagonals correspond to cells for which the difference in preferred orientation is less than the mean HWHH.

