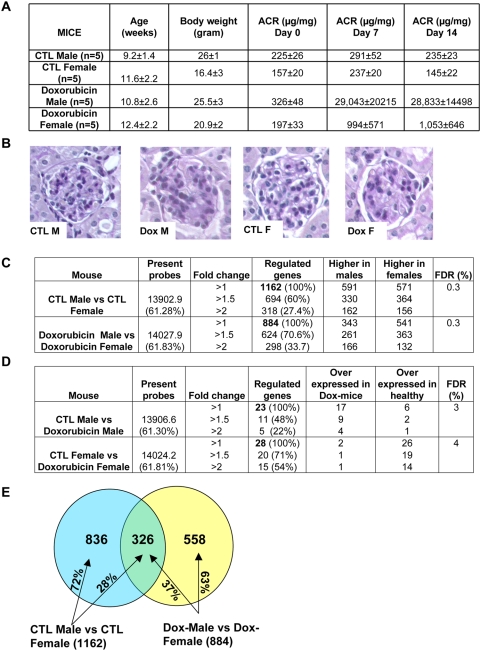
Figure 1. Phenotype and gene expression differences in doxorubicin injected male and female Balb/c mice.
(A) Phenotypic description of the animals used in the study (B) PAS staining of murine kidney sections. CTL-control, dox-14 days following doxorubicin injection, M-male, F-female (C) The number of genes that are differentially expressed in kidneys between male (M) mice and female (F) mice in control (CTL) and diseased (dox) condition induced by doxorubicin. The value in parenthesis shows the percentage of active genes or the percent of all regulated genes. (D) Gene expression regulation between control and diseased male mice, control and diseased female mice (SAM analysis, FDR; false discovery rate). (E) Overlap of sexually dimorphic genes in healthy and diseased condition.

