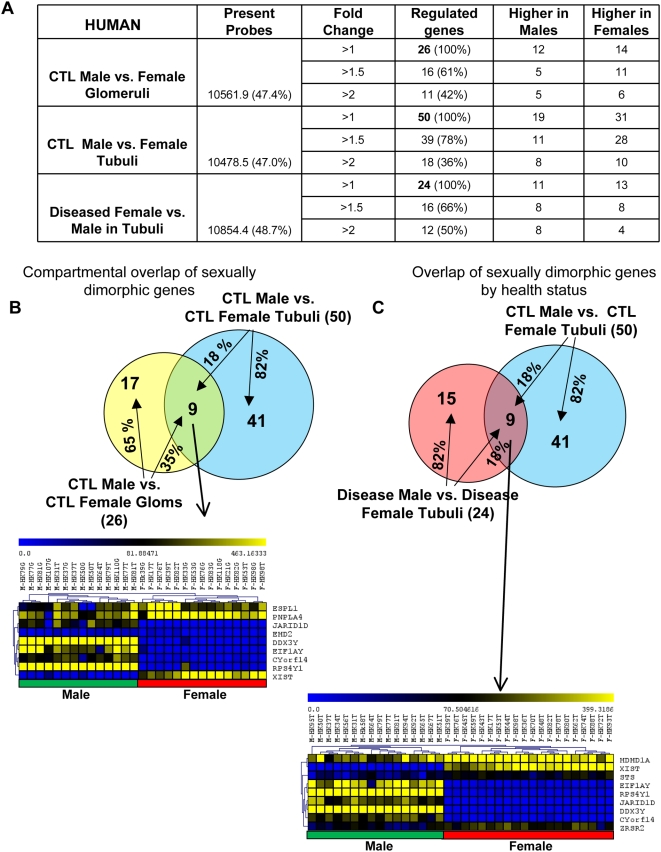
Figure 2. Gene expression changes in control and diseased human kidney samples.
(A) Distribution of genes that are differentially expressed in male and female human kidneys in glomerular and tubulointerstitial compartments (p<0.01, Student's t-test). The value in the parenthesis following the number of dimorphic gene shows the percentage of active probes. (B) Upper panel: the overlap of sexually dimorphic genes when tubuli were compared to glomeruli from healthy kidneys; Lower panel: hierarchical clustering (complete linkage) of the overlapping genes identified between healthy glomeruli and tubuli. (C) Upper panel: the overlap of sexually dimorphic genes when diseased tubuli were compared to healthy tubuli. Lower panel: hierarchical clustering (complete linkage) of the overlapping genes between diseased and healthy tubuli. In the Venn's diagram, the gene number in individual distinct area and the percentage over the total gene number in individual group are shown. In the gene clusters, one row represents one gene and one column represents one sample. The yellow color indicates higher gene expression level, while the blue one indicates lower level.

