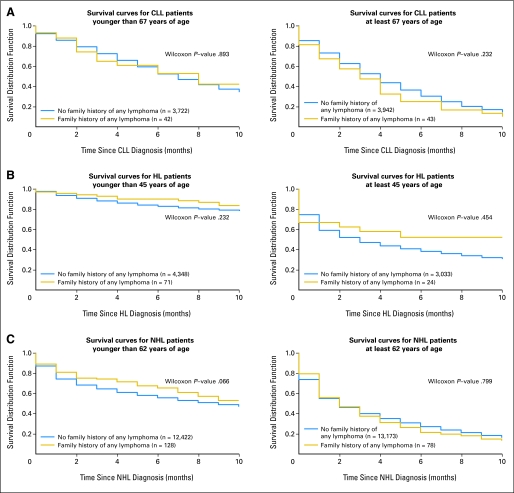
Fig 1.
(A) Survival curves for patients with chronic lymphocytic leukemia (CLL) with and without a family history of any lymphoma. Kaplan-Meier curves are presented stratified by the median age of 67 years. The solid lines represent CLL patients with no family history of lymphoma. The dotted lines represent patients with CLL with a family history of lymphoma. The number of patients with CLL with and without a family history are presented. Survival curves were compared using the generalized Wilcoxon's test; P values are presented. (B) Survival curves for patients with Hodgkin's lymphoma (HL) with and without a family history of any lymphoma. Kaplan-Meier curves are presented stratified by age 45 years. The solid lines represent patients with HL with no family history of lymphoma. The dotted lines represent patients with HL with a family history of lymphoma. The number of patients with HL with and without a family history are presented. Survival curves were compared using the generalized Wilcoxon's test; P values are presented. Median age at diagnosis was used as cut-off. (C) Survival curves for patients with non-Hodgkin's lymphoma (NHL) with and without a family history of any lymphoma. Kaplan-Meier curves are presented stratified by the median age of 62 years. The number of patients with NHL with and without a family history are presented. The solid lines represent patients with NHL with no family history of lymphoma. The dotted lines represent patients with NHL with a family history of lymphoma. Survival curves were compared using the generalized Wilcoxon's test; P values are presented.

