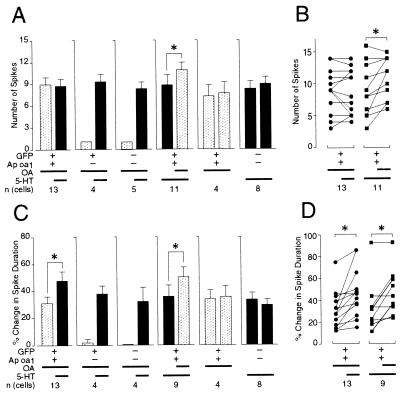
Figure 4.
Group data showing that treatment with 1 μM OA causes increase in membrane excitability (A and B) as well as spike broadening (C and D) in sensory cells that expressed Ap oa1. Changes in membrane excitability are described as number of action potentials under fixed current step command during 500 ms (see Materials and Methods). Data represent the average response to drugs ± SEM. Striped bars indicate the response of the neurons when OA was applied alone or added later on top of 5-HT in the bath. Black bars indicate the response of the neurons when 5-HT was applied alone or added later on top of OA in the bath. +, expression of specific DNA constructs; −, no injection of DNA molecules. Thick lines illustrate the existence of applied drugs (OA or 5-HT) in bath solutions for 10 min (long lines) and 5 min (short lines), respectively. n (cells) is the number of cells examined. (B and D) The paired analyses of percentage change in the number of spikes (B) and spike duration (D) of individual cells. Data were individually compared by using the two-tailed Wilcoxon signed rank test from each cell before and after 5-HT or OA application to the bath that already contained OA or 5-HT, respectively: *, P < 0.02 (n = 11); P < 0.001 (n = 13), P < 0.04 (n = 9).

