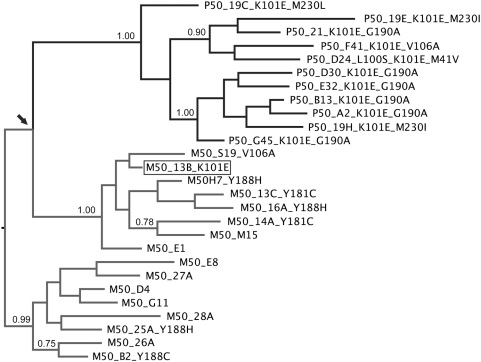
Figure 3. Majority-rule consensus tree of the Bayesian MCMC analyses.
Only posterior probablities >0.75 are shown. The maximum likelihood tree showed a very similar clustering. The arrow indicates the closer relatedness between the mother sequence cluster harboring M50_13B_K101E (boxed) and the child cluster.

