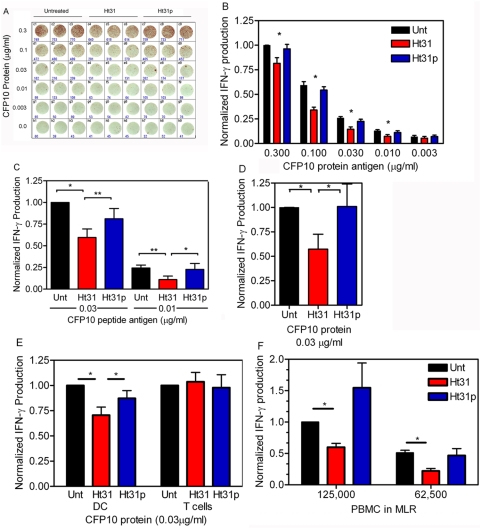
Figure 3. Anchored PKA is required for antigen presentation as assayed by IFN-γ ELISPOT.
A) One representative ELISPOT. Day 5 dendritic cells (iDC) were incubated without (Unt, black bars) or with Ht31 (red bars) or Ht31p (blue bars), and the indicated concentration of CFP10 protein (B) or CFP10 peptide antigen (C) for 1 hr at 37°C. Antigen specific CD4+ clonal T cells were added and IFN-γ production was assayed after 16 hours by ELISPOT. D) Allogeneic day 5 dendritic cells (iDC) were incubated without (Unt, black bars) or with Ht31 (red bars) or Ht31p (blue bars) for 1 hr at 37°C, 5% CO2. The cells were collected, rinsed and replated. Then 0.03 µg/ml of protein antigen (CFP10) was added for 1 hr at 37°C, 5% CO2, and antigen specific CD4+ clonal T cells were added. IFN-γ production was assayed after 16 hours by ELISPOT. E) First set of three bars, experiment is conducted as in (B). Second set of three bars, antigen specific CD4+ clonal T cells were incubated without (Unt, black bars) or with Ht31 (red bars) or Ht31p (blue bars) for 1 hr at 37°C, rinsed, and added to allogeneic day 5 DC preloaded with CFP10 protein antigen (0.03 µg/ml). IFN-γ production was assayed after 16 hours by ELISPOT. The data presented are an average of three independent experiments with values (number of spots counted) normalized to the response at 0.03 µg/ml CFP10 protein (B), 0.03 µg/ml CFP10 peptide (C). F) MLR, CD14+ monocytes were matured and 10,000 DC were plated with 125,000 or 62,500 PBMC as indicated, without (Unt, black bars) or with 100 µM Ht31 (red bars) or Ht31p (blue bars). In all figures error bars represent S.E.M. (B) Two factor ANOVA with repeated Measures on Both Factors was conducted on the un-normalized values (actual count of number of cells making IFN-γ, P<0.05). (C, D, E, F) A student TTEST yielded significance with a P<0.05 (*) or P<0.01 (**).

