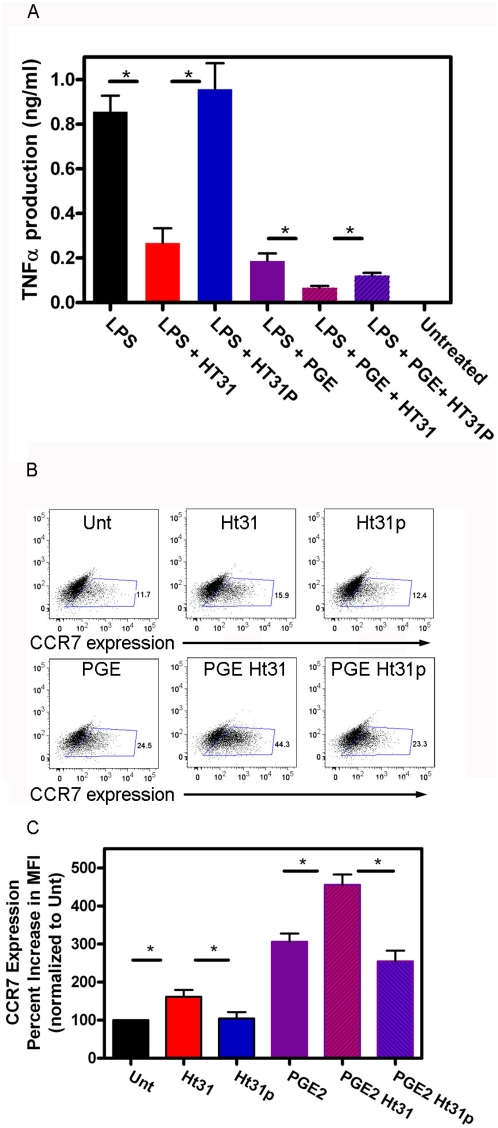
Figure 9. Ht31 inhibits TNF-α production and CCR7 expression.
A) Day 5 DC were incubated with 10 ng/ml LPS without (Unt, black bars) or with 100 µM Ht31 (red bars) or Ht31p (blue bars) and 1 µM PGE2 without (purple bars) or with 100 µM Ht31 (purple and red hatched bars) or Ht31p (purple and blue hatched bars) for 24 hours at 37°C, 5% CO2. Supernatants were collected and used in TNF-α ELISA (Ebioscience). Three experiments were averaged. Error bars are S.E.M. Student TTEST reveals significance, P<0.05(*). B, C) Day 5 DC were incubated without (Unt, black bars) or with 100 µM Ht31 (red bars) or Ht31p (blue bars) and 1 µM PGE2 without (purple bars) or with 100 µM Ht31 (purple and red hatched bars) or Ht31p (purple and blue hatched bars) for 48 hours at 37°C, 5% CO2. Cells were collected, blocked, and stained for cell surface expression with anti-CCR7. FACS analysis was performed on a LSRII using FacsDiva software. B) One representative dot plot for each treatment. C) Three experiments normalized to untreated and averaged. Error bars are S.E.M. Student ttest reveals significance, P<0.05(*).

