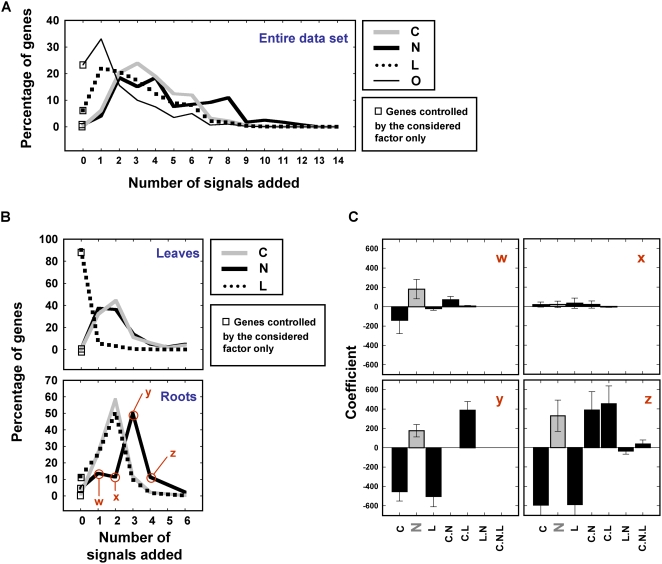
Figure 6. Signal integration of C, L, N and O factors: case of study for nitrogen.
Effect of added signal on the percentage of controlled genes considering each factor at A) the whole dataset level or B) the organ specific level. C) Centroid-plots of model coefficients for the gene lists (w,x,y,z) considered in (B). Note that in C-x, the N effect is significant (by definition), but no trend between genes gathered in the list can be visualized. Some of the genes are positively controlled by N, others are negatively controlled.

