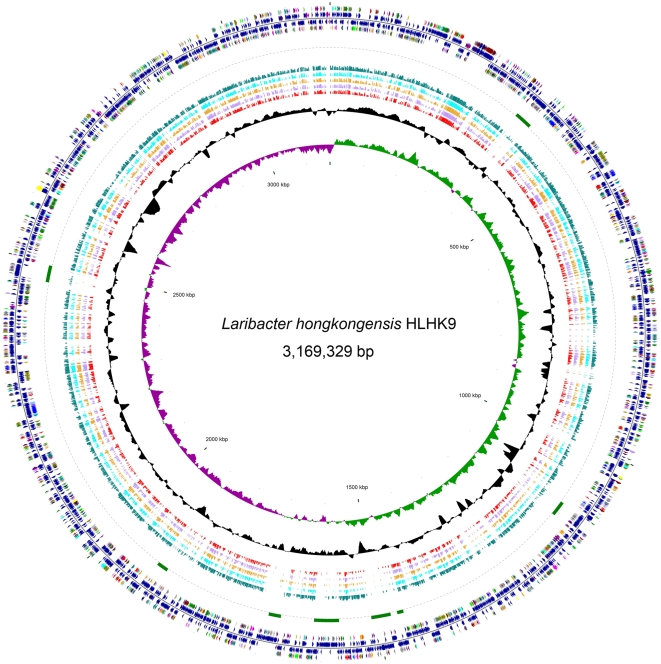
Figure 1. Circular representation of the genome of L. hongkongensis HLHK9.
From the inside: circles 1 and 2, GC skew (dark green indicates values >0 and dark purple indicates values <0) and G+C content (10-kb window with 100-b step); circles 3 to 7, red, light purple, orange, aqua and teal bars show BLAST hits to Neisseria gonorrhoeae FA 1090, Neisseria gonorrhoeae MC58, Neisseria gonorrhoeae FAM18, Neisseria gonorrhoeae Z2491 and Chromobacterium violaceum ATCC 12472, respectively; circle 8, green arcs show location of eight putative prophages; circles 9 and 12, colors reflect Cluster of Orthologous Groups of coding sequences (CDSs). Maroon, translation, ribosomal structure and biogenesis; navy, transcription; purple, DNA replication, recombination and repair; light brown, cell division and chromosome partitioning; aqua, posttranslational modification, protein turnover, chaperones; teal, cell envelope biogenesis, outer membrane; blue, cell motility and secretion; orange, inorganic ion transport and metabolism; light purple, signal transduction mechanisms; olive, energy production and conversion; lime, carbohydrate transport and metabolism; green, amino acid transport and metabolism; fuchsia, nucleotide transport and metabolism; light pink, coenzyme metabolism; red, lipid metabolism; yellow, secondary metabolites biosynthesis, transport and catabolism; gray, general function prediction only; silver, function unknown; circles 10 and 11, dark blue, dark red and dark purple indicate CDSs, tRNA and rRNA on the − and + strands, respectively.

