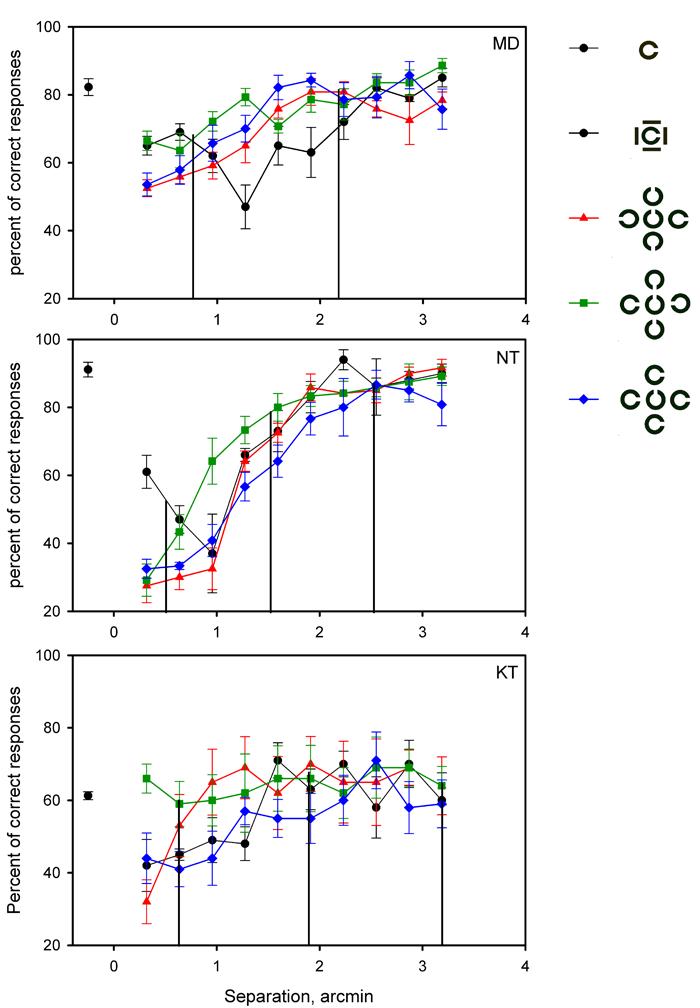
Figure 5.

Percent of correct responses plotted against spatial separation for three observers (MD, NT and KT). The Landolt C was surrounded either by four tangential bars (black lines and black symbols), or by four Landolt C's rotated outwards (red lines and red symbols), or by four Landolt C's rotated inwards (green lines and green symbols), or by four Landolt C's facing left (blue lines and blue symbols). The vertical lines correspond to one, three and five gap widths. Error bars represent SEM.
