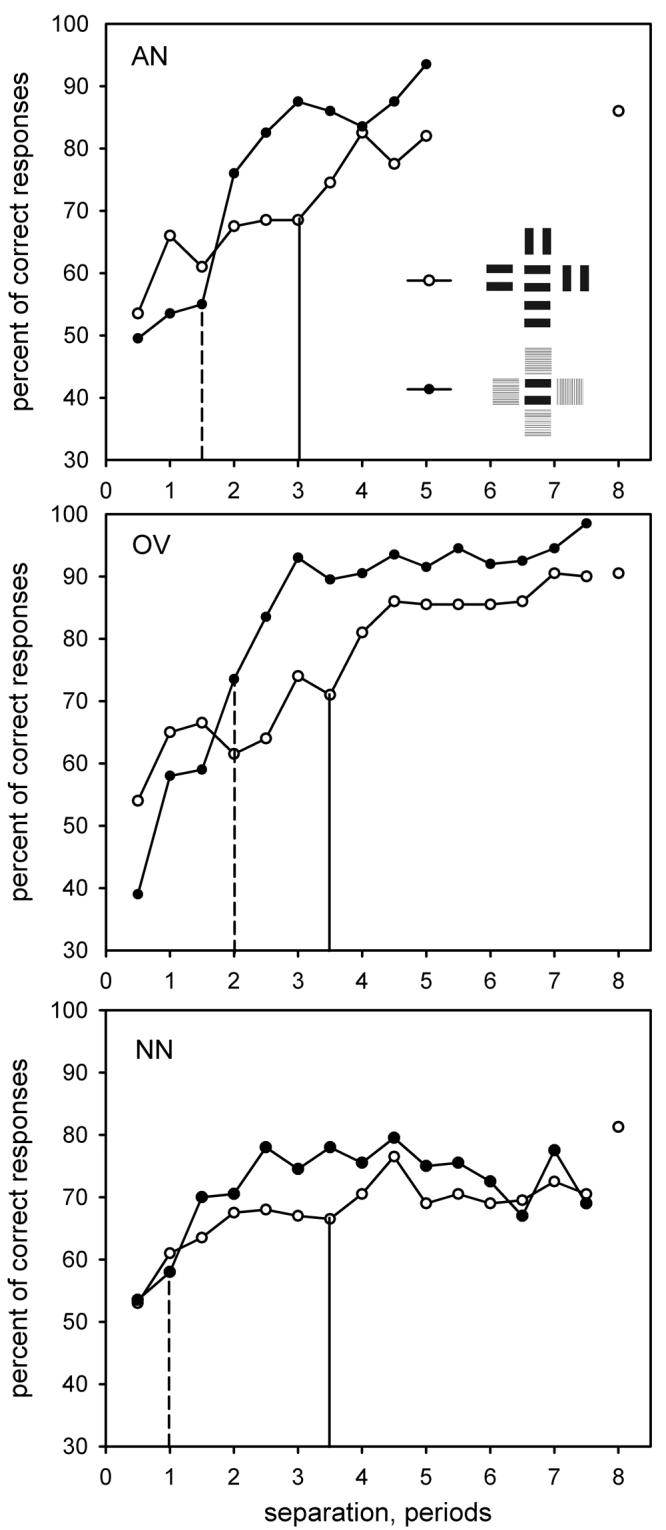
Figure 7.

Percent of correct responses is plotted against spatial separation between the test rectangular grating and four surrounding gratings of different spatial frequency having random orientation, Solid vertical lines denote the critical spacing when surrounding gratings had the same spatial frequency as the test grating; dashed lines show the critical spacing when surrounding gratings were of high spatial frequency.
