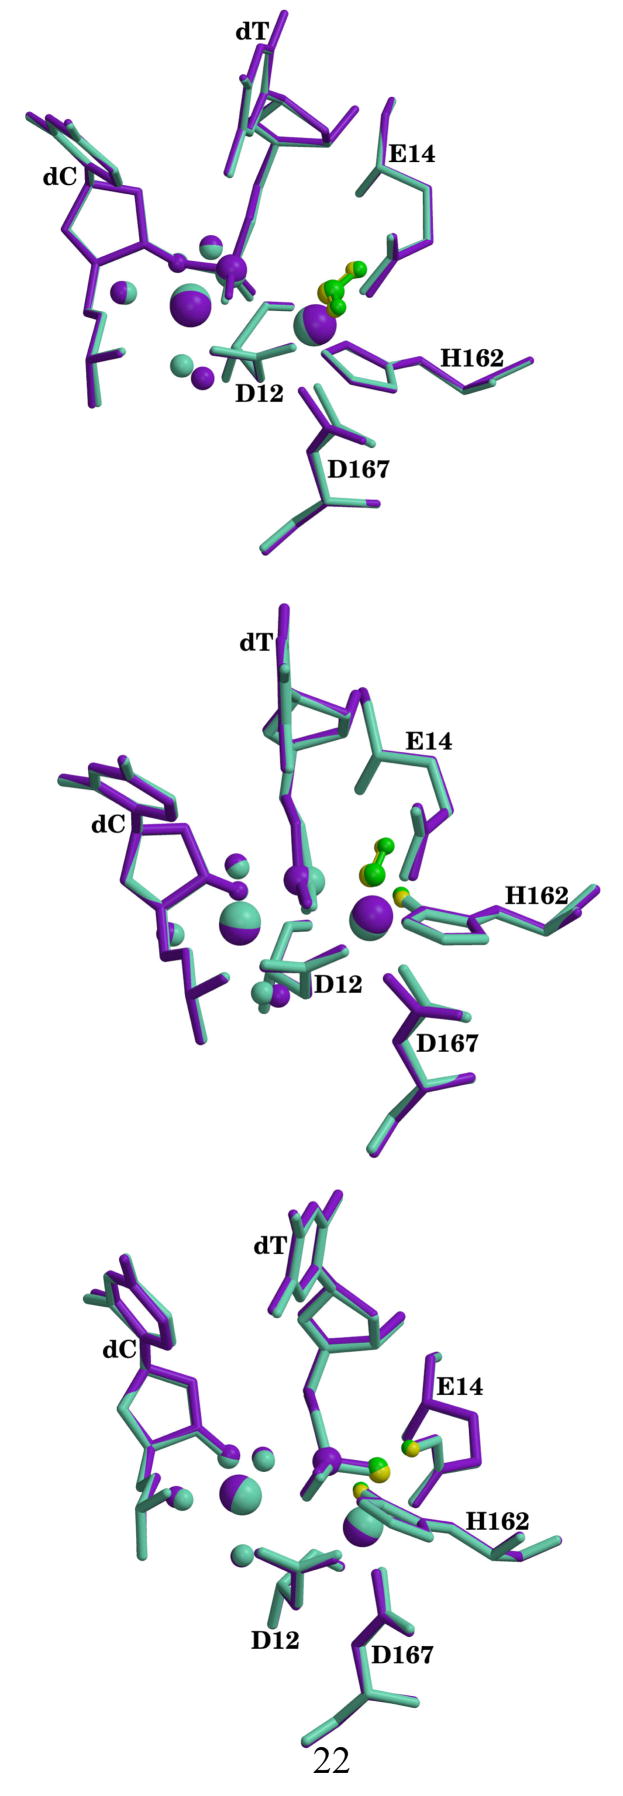
Figure 4.
Superposition of active sites for the calculated reactants (top), transition states (middle) and products (bottom) from the ε 186–HOT structures. Mg2+ structure is shown in aquamarine with nucleophilic water in yellow and Mn2+ structure is shown in purple with nucleophilic water in green. The nucleophilic waters are shown in ball and sticks while divalent metals are rendered as large spheres. Electrophilic phosphate, O3′ on dC and waters coordinating the nucleotide binding metal are shown as spheres. Hydrogen atoms except for the ones on the nucleophilic waters have been omitted for clarity.

