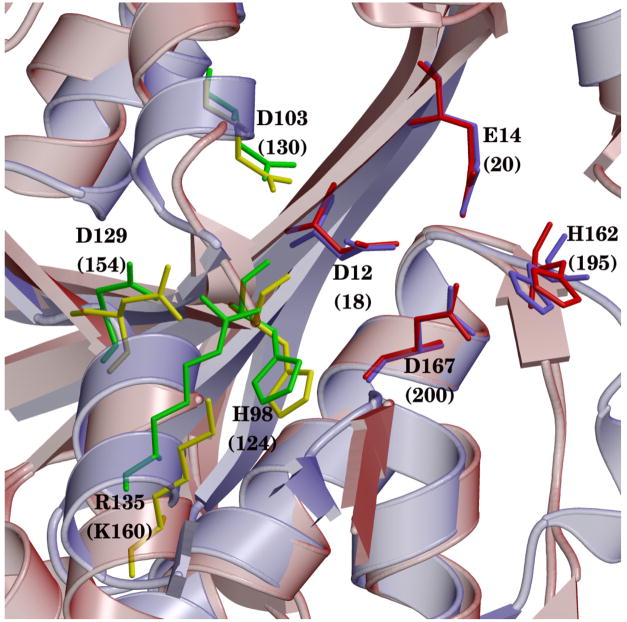
Figure 7.
Structural alignment comparing residues obtained from the decomposition analysis in ε 186–HOT (light blue) superposed with the exonuclease domain (red) of TREX1 (red). Residues from energy decomposition for ε 186–HOT are shown in green; structurally homologous residues for TREX1 are shown in yellow. Metal binding residues (and H162) for ε 186–HOT are shown in light blue; structurally homologous residues for TREX1 are shown in red.

