
FIGURE 1.
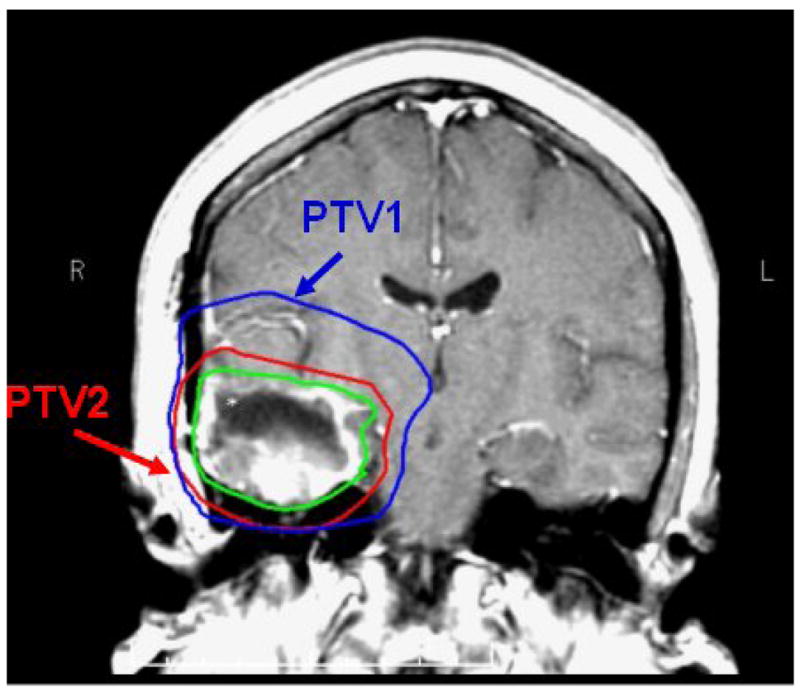
Coronal slice of T1 post-gadolinum MRI with GTV outlined in green. PTV1, shown in blue, receives 60 Gy in 30 fractions. PTV2, shown in red, receives protocol dictated dose over the same 30 fractions using a conformal simultaneous IMRT boost.