FIGURE 3.
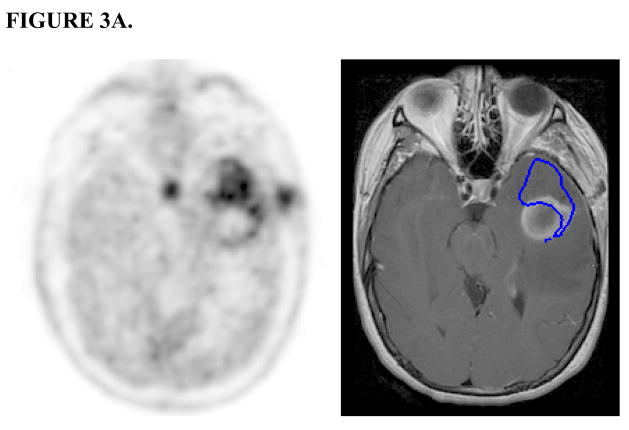
FIGURE 3A. MET-PET (left) and Gd-enhanced T1-weighted MRI (right) after stereotactic biopsy. PET-GTV (outlined in blue on MRI) extends beyond the contrast-enhancing lesion.
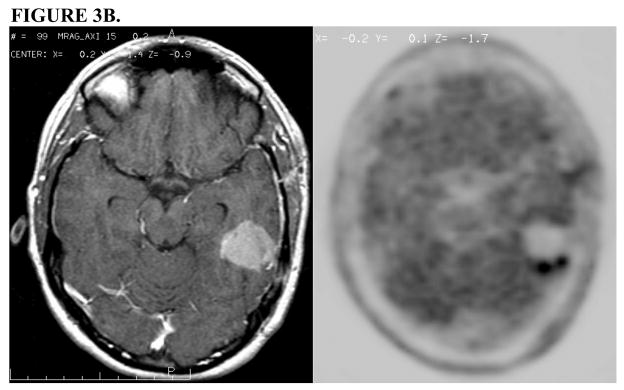
FIGURE 3B. Post-operative Gd-enhanced T1-weighted MRI (left) demonstrates resection cavity with no evidence of residual disease, but 11C Methionine PET scan (right) demonstrates an area of residual tumor that was not appreciated on the MRI.


