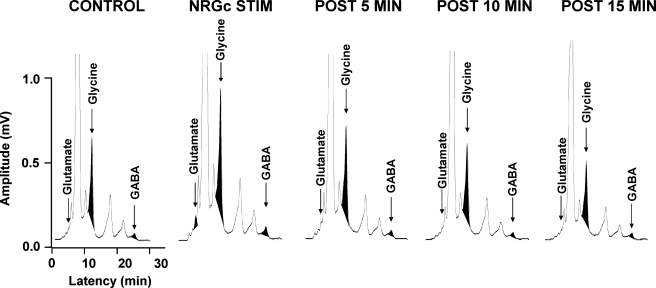
FIG. 4.
Example of HPLC chromatograms illustrating elution peaks for glutamate, glycine, and GABA during control periods of wakefulness, a test period of electrical stimulation of the NRGc, and recovery from stimulation. Each chromatogram represents an individual spinal dialysate sample collected over a 5-min period. Note that electrical stimulation of the NRGc (4 pulses, 0.8-ms duration, 2.5-ms interpulse interval, 120 μA, 1.0 Hz) resulted in enhanced magnitude of amino acid signals. The NRGc-induced increase in amino acid levels in this example was transient and occurred only during the presentation of electrical stimuli.

