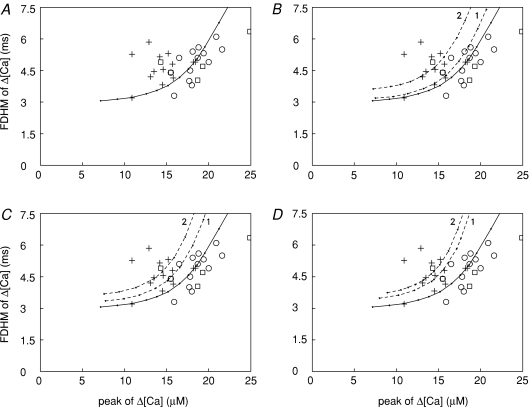
Figure 4. Relations between the FDHM and peak of Δ[Ca2+] elicited by an AP.
A, + represent mdx fibres and open symbols represent normal fibres (squares, C57BL/10 mice; circles, Balb-C mice). The continuous curve was obtained in simulations with the standard parameter values of the multi-compartment model; the amplitude of the SR Ca2+ release flux was varied incrementally while the FDHM of the flux was fixed at 1.57 ms (the value used for the normal fibre simulation in Table 2). The symbols and curve are also shown in B–D. B, the dashed curve labelled ‘1’ was obtained in the same way as the continuous curve except that [Ca2+]R was 100 (rather than 50) nm. Dashed curve ‘2’ was obtained with the same conditions as for curve ‘1’ except that the FDHM of the release flux was 1.81 ms (as in row B2 in Table 2) rather than 1.57 ms. C and D, dashed curves labelled ‘1’ were obtained as in B except that, in C, [ParvT] was 900 (rather than 1500) μm and, in D, [Ca2+]R was 100 nm and [ParvT] was 900 μm. Dashed curves ‘2’ were obtained with the same conditions as for curves ‘1’ except the FDHM of the release flux was 1.75 ms in C and 1.67 ms in D (as in rows B3 and B4, respectively, in Table 2).

