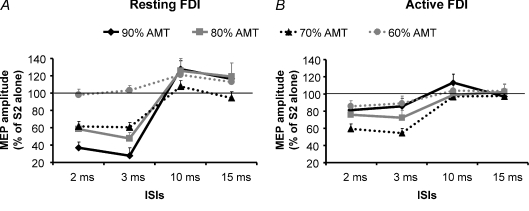
Figure 1. SICI and ICF assessed in the cortical representation of the first dorsal interosseus (FDI) muscle in resting and active conditions.
Mean data obtained from 16 subjects are reported. The effects of four different intensities of the conditioning stimulus (S1) (90% AMT (♦), 80% AMT (▪), 70% AMT (▴), 60% AMT (•)) on the size of the conditioned MEP were evaluated in the FDI muscle relaxed (A) and activated at 10% MVC (B). At rest the best inhibition was obtained delivering a S1 of 90% AMT while during contraction the most efficacious S1 was 70% AMT. At ICF ISIs the highest S1 intensity was able to induce a significant facilitation only in the relaxed muscle. The abscissa indicates interstimulus intervals (ISIs) while the ordinate indicates mean MEP amplitude expressed as a percentage of the S2 given alone. The thin horizontal lines indicate the 100% level. Error bars represent s.e.m.

