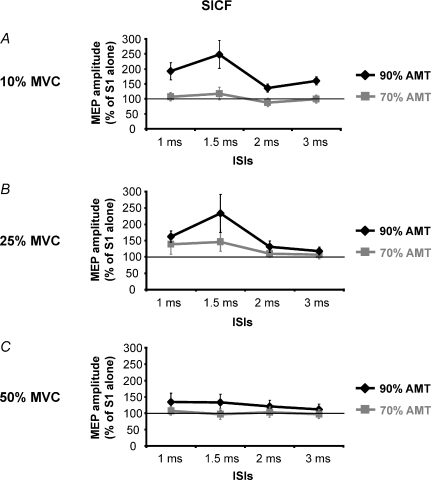
Figure 6. Effects of different levels of contraction on SICF.
Those ISIs where significant facilitatory peaks were previously found (Expt 5a, Fig. 6) were tested in four subjects. Three contraction levels (A: 10% MVC; B: 25% MVC; C: 50% MVC) were evaluated. For each of these levels of contraction, two S2 intensities, 90% AMT (black line) and 70% AMT (grey line), were evaluated. S1 was kept constant at 1 mV. Only using a S2 of 90% AMT was a MEP facilitation seen at 10% and 25% MVC. This facilitation was gradually reduced in amplitude with increasing contraction level and disappeared at 50% MVC. With a S2 of 70% AMT no significant facilitation was observed at any contraction level. Abscissa reports ISIs; the ordinate reports conditioned MEP amplitude which is expressed as a percentage value of the control MEP (S1). The thin horizontal line indicates the 100% level. Error bars represent s.e.m.

