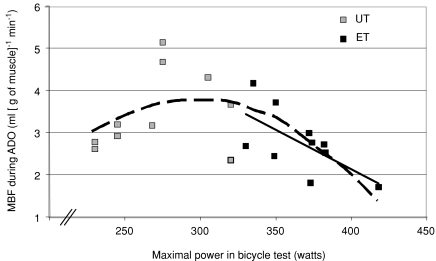
Figure 5. Relationship between maximal sustained power obtained during bicycle test (Wmax) and myocardial blood flow during adenosine infusion (MBF during ADO).
In UT, Wmax was not related to MBF during ADO (r= 0.28, P= 0.44, grey squares), but in ET these parameters were inversely related (black squares and line, r= 0.64, P= 0.04). Interestingly, if the subjects are considered showing a continuum of inborn and acquired fitness, a curvilinear relation between fitness level and MBF during adenosine-induced hyperaemia in the whole subject population is observed (dashed line, y= 0.0002x2+ 0.0981x− 10.824, r2= 0.42, P= 0.002).

