
FIG. 4.
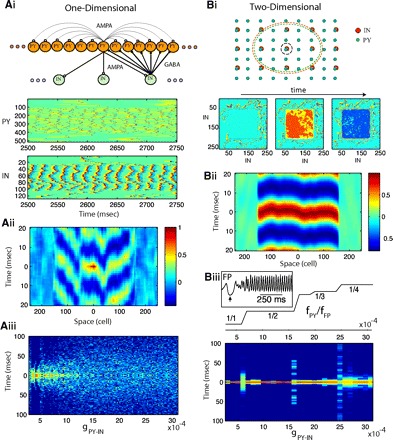
Synchrony of oscillations in 1- and 2-dimensional (2D) network models. Group of PY neurons [with indexes (107,406) for 1D or (107,406) × (107,406) for 2D] was entrained to gamma oscillations by DC input. A: 1D model: 512 PY neurons and 128 INs. Ai, top: connectivity structure. Bottom: spatiotemporal patterns of activity in a 1D network (gIN-PY = 0.0007, gPY-IN = 0.0015). Spikes are shown in red; dark blue indicates hyperpolarization. Aii: cross-correlation of the local field potential (averaged over 20 PY neurons) between the center of the network and remote sites. Aiii: time lags to the main peak of the cross-correlation function between local field potentials in different spatial locations (see methods) plotted for various strengths of PY-IN coupling. Color indicates number of time lags within 1 ms bins (dark blue indicates no lags). B: 2D model: 512 × 512 PY neurons and 256 × 256 INs. Bi, top: connectivity structure. Red and green dashed circuits illustrate radii of PY-IN and IN-PY connectivity for a single PY and IN neurons (shown with black circuit). Bottom: snapshots of activity in the IN population during global coherent gamma oscillation at times t0, t0+5 ms, t0+8 ms. Bii: cross-correlation of the local field potential (averaged over 20 × 20 PY neurons) between the center of the network and remote sites along the x axis. Biii, top: the staircase structure of resonance modes (fPY/fFP ) is shown as a function of PY-IN coupling. Bottom: same as in Fig. 3Aiii but for a 2D network. Inset: field potential oscillations near the onset of DC input (↑).