
FIG. 5.
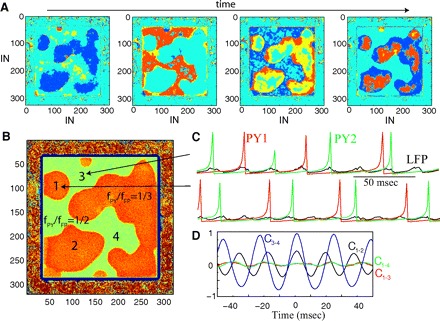
Two-dimensional network dynamics at the transition between 2 resonance states. A: representative snapshots of network activity at 4 different times illustrated with IN population. Network size: 640 × 640 PY neurons and 320 × 320 INs. B: spatial distribution of the resonance modes computed as the ratio of the total number of IN spikes to the total number of PY spikes in each network site during a given time interval. Orange (green) area indicates fPY/fFP = 1/3 (fPY/fFP = 1/2) resonance mode, respectively. Note that the population of neurons in fPY/fFP = 1/3 mode (orange area) is broken into several disjointed sets. C: examples of oscillations in 2 network sites (1 and 3 in B) belonging to different resonance areas (black indicats field potential; green and red indicates PY neurons). D: cross-correlation of the field oscillations among 4 network sites indicated in B. The synchrony was high between sites 3 and 4 (C3–4, the same population); moderate between sites 1 and 2 (C1–2, disjoint populations of the same type); low between 1 and 3 or 1 and 4 (C1–3, C1–4, populations oscillating in different resonance modes).