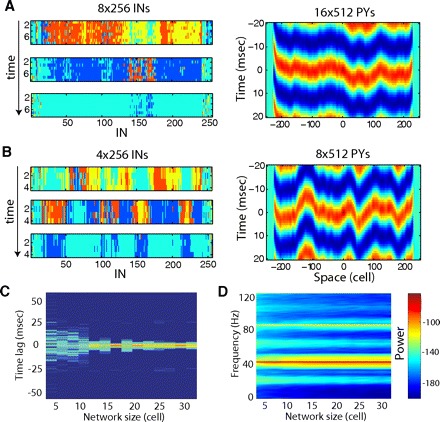
FIG. 7.

Effect of network dimensionality on gamma range synchronization. A: oscillations in the 16 × 512 PYs (8 × 256 INs) network model. Snapshots of IN activity as 3 different times (left) and cross-correlation of field potentials along x axis (right). B: oscillations in the 8 × 512 PYs (4 × 256 INs) network model. C: normalized probability density distribution of time lags to the main peak of the cross-correlation function between local field potentials at different spatial locations as a function of the network size along the y dimension. Logarithmic scale. Results are averaged across 15 independent trials with randomly selected initial conditions. Note disappearance of the isolated peak for the network of size <1 footprint (8 PY neurons). D: spectrogram of the local field potential [averaged across all neurons within (150,350) × (1, N) area, where N is number of PY neurons along y axis] as a function of the network's size along the y-dimension. Logarithmic scale (dB). E, left: cross-correlation of field potentials along x axis in 2D model with radius of the synaptic footprint 4 for PY-PY and PY-IN synapses (total 47 and 48 neurons, respectively) and 2 for IN-PY synapses (total 13 neurons). Right: cross-correlation of field potentials along the chain of neurons in 1D model with radius of the synaptic footprint 24 for PY-PY and PY-IN synapses (total 47 and 48 neurons, respectively) and 6 for IN-PY synapses (total 13 neurons). Not only is delay to the peak of cross-correlation function larger in 1D model but also the amplitude of the correlation function is significantly reduced in 1D model.
