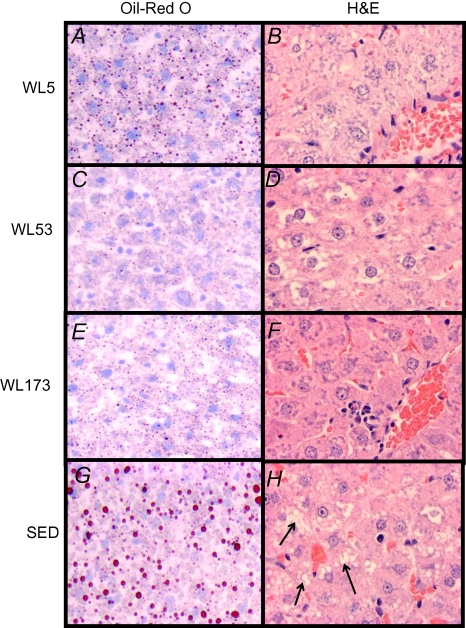
Figure 1. Representative images of haematoxylin and eosin (H&E) and Oil-Red O staining.
Oil-Red O staining in WL5 (A), WL53 (C), WL173 (E) and SED (G). Red droplets indicate neutral lipid staining. Quantification of Oil-Red O lipid staining is shown in Table 2. H&E staining from WL5 (B), WL53 (D), WL173 (F) and SED (H).

