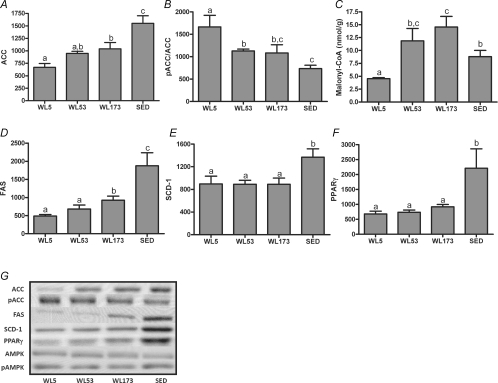
Figure 3. Effects of 5 h, 53 h and 173 h of physical inactivity on liver ACC (A), pACC (B), malonyl-CoA (C), FAS (D), SCD-1 (E) and PPARγ (F) protein content.
Representative Western blots for each and AMPKα and pAMPK are shown in G. Values (means ±s.e.m.; n= 6–8) with different letters are significantly different (P < 0.05).

