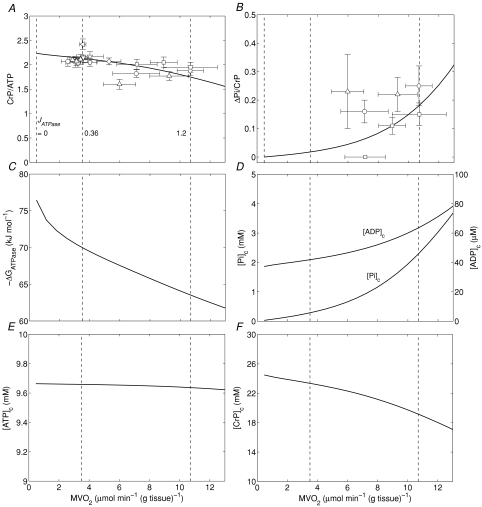
Figure 2. Steady-state energetics phosphate metabolites as functions of myocardial oxygen consumption.
A, model-predicted steady-state CrP/ATP level plotted as a function of oxygen consumption rate,  , and compared to experimental data from canine heart in vivo. B, model-predicted steady-state ΔPi/CrP plotted as a function of
  . C, model-predicted steady-state free energy of ATP hydrolysis, −ΔGATPase, is plotted as a function of
  . D, model-predicted steady-state cytoplasmic inorganic phosphate concentration, [Pi]c and ADP, [ADP]c, plotted as a functions of
  . E, model-predicted steady-state cytoplasmic ATP, [ATP]c, plotted as a function of
  . F, model-predicted steady-state cytoplasmic CrP [CrP]c, plotted as a function of
  . For all simulations,
  is varied by varying the rate of ATP hydrolysis, JATPase, in the cytoplasm. Experimental data are obtained from the following sources: ○, Zhang et al. (2005) (dobutamine + dopamine); ▵, Zhang et al. (2003), ◊, Gong et al. (2003) (dobutamine + dopamine); ▵, Ochiai et al. (2001) (dobutamine + dopamine); ▿, Gong et al. (1999), □, Bache et al. (1999) (dobutamine, dobutamine +dopamine). Here protocols used to elevate work load from baseline are indicated in parentheses. The values of JATPase corresponding to baseline and maximal
  , 0.36 and 1.2 mmol s−1 (l cell)−1, respectively, are indicated in A. Error bars indicate standard error.

