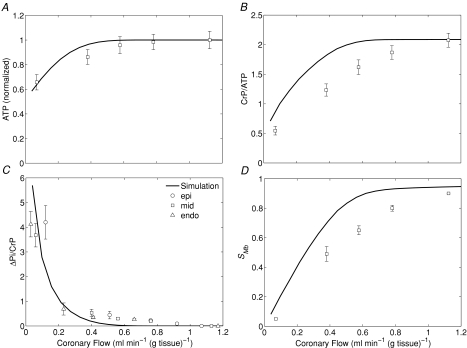
Figure 5. Cardiac energetic phosphate metabolite levels and myoglobin saturation during coronary hypoperfusion.
A, model-predicted steady-state ATP levels (normalized to baseline value) as a function of coronary blood flow. B, model-predicted steady-state CrP levels (normalized to ATP) (CrP/ATP). C, model-predicted steady-state ΔPi/CrP, as a function of coronary blood flow. D, model-predicted steady-state myoglobin saturation, SMb, as a function of coronary blood flow. Experimental data obtained from Zhang et al. (2001). In C, data are divided into epicardium (epi), midwall (mid) and endocardium (endo), as indicated in the figure. Error bars indicate standard error.

