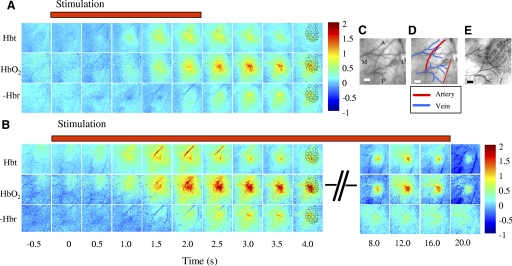
FIG. 1.
The hemodynamic response for short (2 s) and long (16 s) whisker C1 stimulation. A: image montage for total blood volume (Hbt), oxyhaemoglobin (HbO2) and deoxyhemoglobin (Hbr) for short stimulation of whisker C1. The scale bar represents the micromolar change from baseline. Stimulation occurs at time 0. Both Hbt and HbO2 increase after stimulus onset, Hbr decreases (Hbr has been inverted so decreases appear as red regions). The Hbt increase is localized to the area surrounding barrel C1 and a branch of the middle cerebral artery lying anterior to it. The HbO2 response is less localized than Hbt and after 3.5 s is localized to the draining veins. The Hbr decrease is also localized to the draining veins. B: image montage for Hbt, HbO2 and Hbr for long stimulation of whisker C1. The onset responses for the long duration stimulation are similar to the short duration albeit at a slightly larger magnitude. For Hbt as the arterial response returns to baseline after 3 s a very localized region remains for the duration of the stimulation period, that overlies the whisker C1 barrel region. HbO2 is less localised than Hbt and is biased towards the draining veins and the Hbr decrease remains localized to the draining veins. C: and D: in vivo images of the surface vasculature show the branches of the middle cerebral artery (MCA) and draining veins. E: the relationship of the barrel cortex to the surface vasculature is shown in a combined post mortem image. This post mortem image was fitted to the in vivo image so that the barrels could then be superimposed over the activation maps as a reference (these are shown in the images 4 s after stimulation onset). Scale bar = 500 μm. M, medial; L, lateral; A, anterior; P, posterior.

