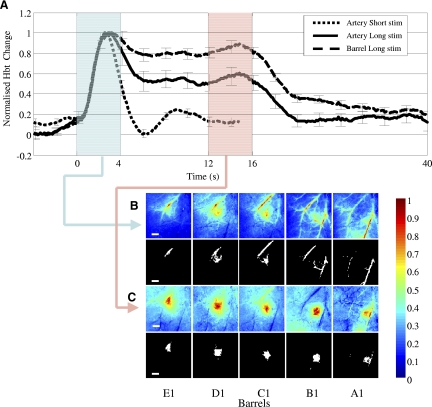
FIG. 3.
Transient arterial response. A: normalised average (across all barrel experiments) total blood volume (Hbt) times series responses for an artery region for short (2 s) and long (16 s) duration stimulation and Hbt time series for long stimulation taken from the barrel region, (mean of 40 barrels from 8 rats, error bars = SE). The transient nature of the arterial response is independent of stimulus duration, whereas the Hbt response from the barrel remains elevated for the period of stimulation. Highlighted regions are the time where the average was taken to produce the images in B and C. B: normalized average Hbt images and activated image region masks selected for subsequent analysis taken from the first 4 s after stimulus onset from the representative animal shown in Figs. 1 and 2. The masks were calculated by including all pixels with 50% of the peak response. For all whiskers stimulated the initial response is localized to branches of the MCA. C: normalised average Hbt images and activated image region masks taken from 12–16 s of the stimulation period again from the same representative animal shown in Figs. 1 and 2. These responses are localised to the individual barrel columns. Scale bar = 500 μm.

