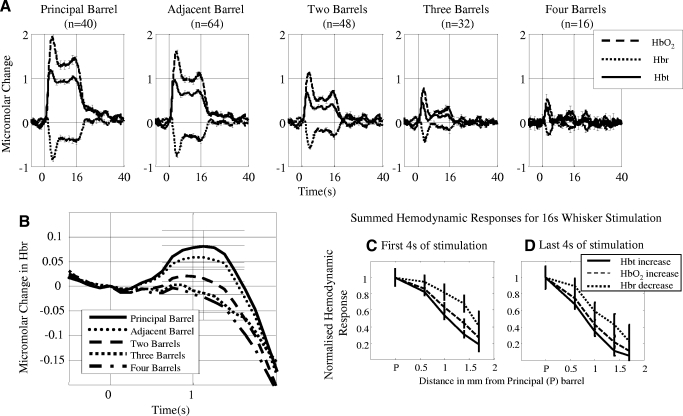
FIG. 5.
Average Micromolar time series changes from all experiments in total blood volume (Hbt), oxyhemoglobin (HbO2) and deoxyhemoglobin (Hbr) for long whisker stimulation as a function of distance relative to the principal barrel. A: responses for long (16 s) stimulus duration. These responses can be characterized for Hbt and HbO2 as initial increases followed by a plateau phase that lasts for the duration of stimulation. For Hbr again there was a transient increase followed by a decrease below baseline and then a continued plateau below baseline for the duration of the stimulation period. (Error bars = SE). B: transient increase in deoxyhemoglobin for long (16 s) stimulation. The largest increase is from the principal barrel and the smallest in the barrel 4-distant. C: normalized hemodynamic response measurements for the first 4 s of long duration stimulation. D: normalized hemodynamic response measurements for the last 4 s of long duration stimulation. Although the results for the first and last 4 s are similar to the short stimulation there are differences. In both conditions the sharpest decline (smaller proportional response size) as a function of distance is from the Hbt measurement. The responses for all three variables decrease more sharply for the last 4 s of stimulation compared to the first 4 s.

