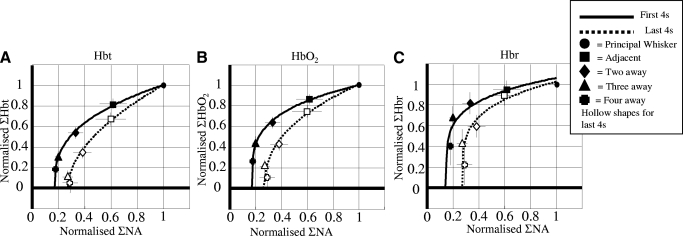
FIG. 7.
Neural and hemodynamic responses for long stimulation. Normalized neural and (a) Hbt, (b) Hbo2 and (c) Hbr responses plotted against one another for the first and last 4 s of stimulation. All the responses were non-linear in shape and fitted with a monotonic relationship defined by the equation Hx = c (E − b)p. For all cases there was a greater hemodynamic response in the first 4 s compared to the last 4 s for a proportional measure of neural activity (NA). Strongly suggesting the hemodynamic measurements taken for the last 4 s are more localized.

